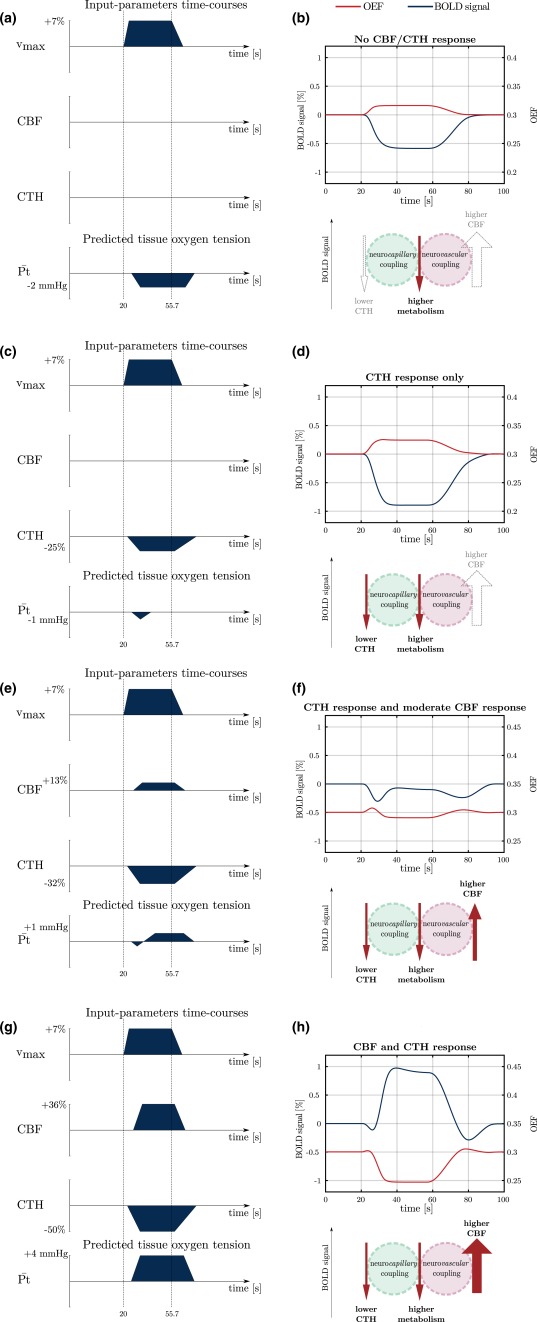
Figure 4.

Influence of the amplitude of CBF and CTH responses on the BOLD signal amplitude (blue curves) and on OEF (red curves). In this figure, the metabolism and the blood flow responses are assumed to be reduced by half compared to the description in Section 2.2. CTH response is assumed to be reduced accordingly. On the left hand side of the figure, the dark blue fillings indicate the temporal dynamic of , CBF, and CTH and predictions for the mean tissue oxygen tension. Note that for clarity, the different parameter time courses are not to scale. Under the BOLD signal, a schematic similar to Figure 3 shows the different contributions to the BOLD signal [Color figure can be viewed at http://wileyonlinelibrary.com]
