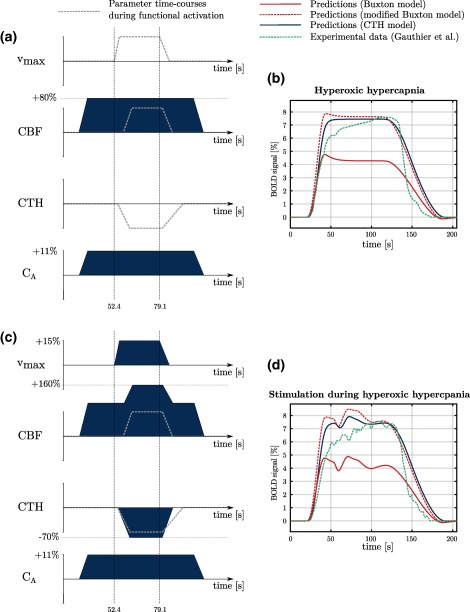
Figure 7.

BOLD signal predictions under conditions inspired from hyperoxic hypercapnia. Under these conditions, hyperoxia is associated with increased oxygen arterial concentration (C A). On the right hand side of the figure, our predictions (CTH model, blue line), predictions made with Buxton and colleagues’ model (red lines) and experimental data (green line) are displayed. See main text for explanation regarding differences between red solid and red dashed lines. For predictions with the modified Buxton model, parameters and were set to 0.475 and 19.75 s, respectively, following the calibration described in methods section. To allow comparison of our predictions with experimental data, green curve width has been adjusted. However, no amplitude adjustment has been made. The green curve amplitude is therefore accurately reproduced from Gauthier et al. (2011) [Color figure can be viewed at http://wileyonlinelibrary.com]
