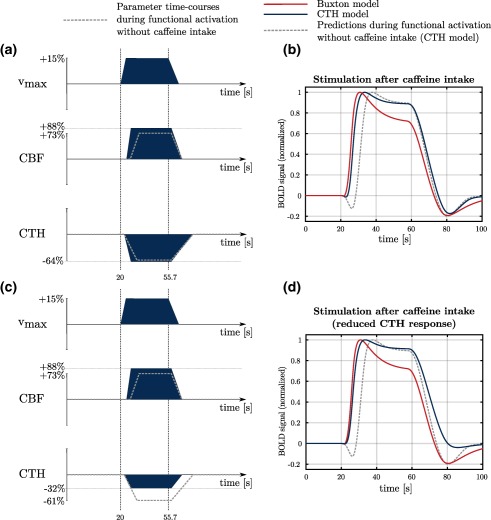
Figure 8.

BOLD signal predictions under conditions inspired from stimulation after caffeine intake. Predictions made with our CTH model are shown with the blue curve and predictions based on Buxton et al.'s model (red curve) are shown for comparison. In the first condition (labeled stimulation after caffeine intake), the CBF response is quicker (onset time = 600 ms after metabolism increase; rise time = 6.3 s) and slightly more important ( ) than during functional activation without caffeine (+73%; onset time = 900 ms after metabolism increase; rise time = 12 s). The CTH response varies accordingly (rise time = 6.6 s; decrease by 64%; vs rise time = 12.6 s and decrease by 61%). In the second condition (labeled stimulation after caffeine intake reduced CTH response), we made the hypothesis that caffeine intake is associated with lactate production, and hence with reduced baseline CTH and reduced CTH response (−32%). CBF in both conditions follows the same time course. Baseline CBF (and CTH) is assumed to be 20% smaller than in other conditions. Accordingly, in this figure, [Color figure can be viewed at http://wileyonlinelibrary.com]
