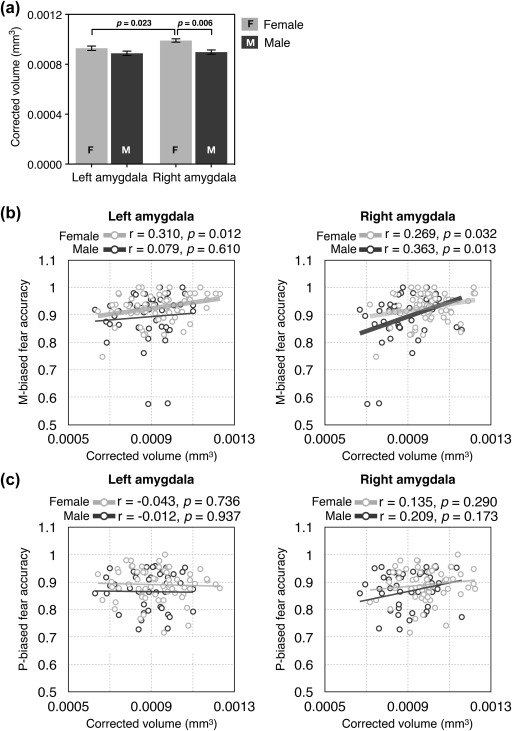
Figure 5.

The results of the analyses of amygdala volumes. (a) The volume of the left and right amygdala for female and male participants. (b) The correlation between the left and the right amygdala volume and the behavioral accuracy for M‐biased fear. The dots with brighter gray indicate female participants and the dots with darker gray indicate male participants. The thicker regression lines indicate the statistically significant correlations. (c) The correlation between the left and the right amygdala volume and the behavioral accuracy for P‐biased fear. The dots with brighter gray indicate female participants and the dots with darker gray indicate male participants
