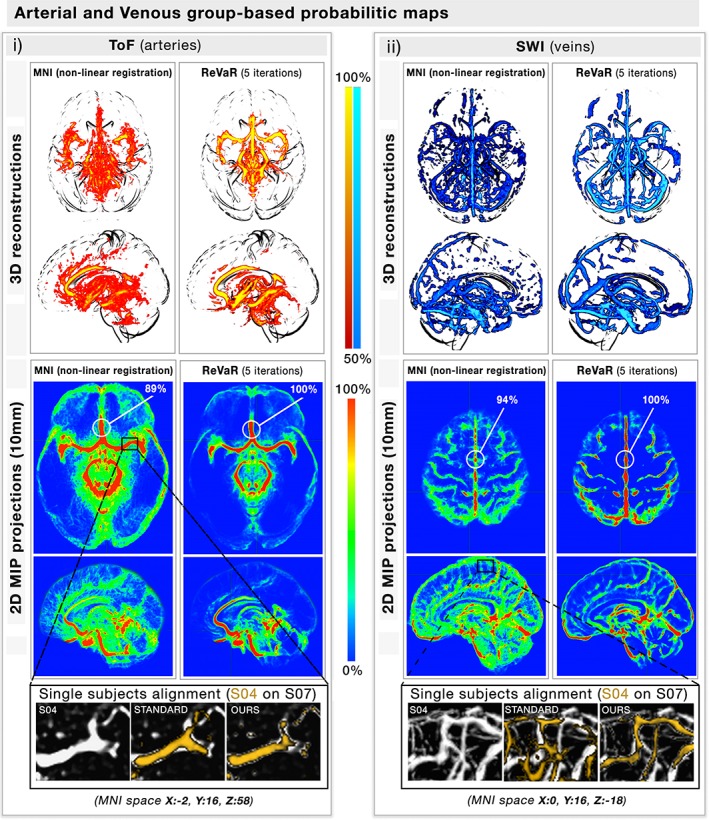
Figure 2.

Venous and arterial probabilistic mapping. (a,b) The figure illustrates on both a 3d view (top) and a 10 mm MIP projection (bottom) how our (b) recursive vascular registration refinement (ReVaR), involving an iterative back‐projection scheme involving 5 iterations of nonlinear registration, performed compared to (a) using a standard nonlinear registration. The coloration represents for each voxel the probability of finding a vessel at that location. The zoom section illustrates the alignment of the vessels of two single subjects, with and without our approach [Color figure can be viewed at http://wileyonlinelibrary.com]
