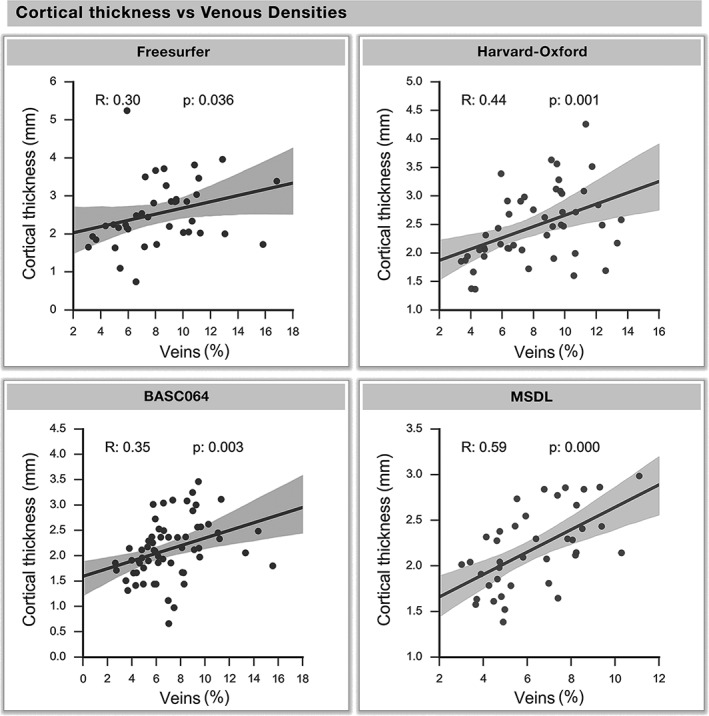
Figure 8.

Cortical thickness versus venous density. The cortical thickness and venous density of each region are corresponded across all atlases. Each dot represents a region of an atlas, whereas the regression line and the 95% interval of confidence of the linear fit (shaded areas) are computed separately
