
Figure 2.
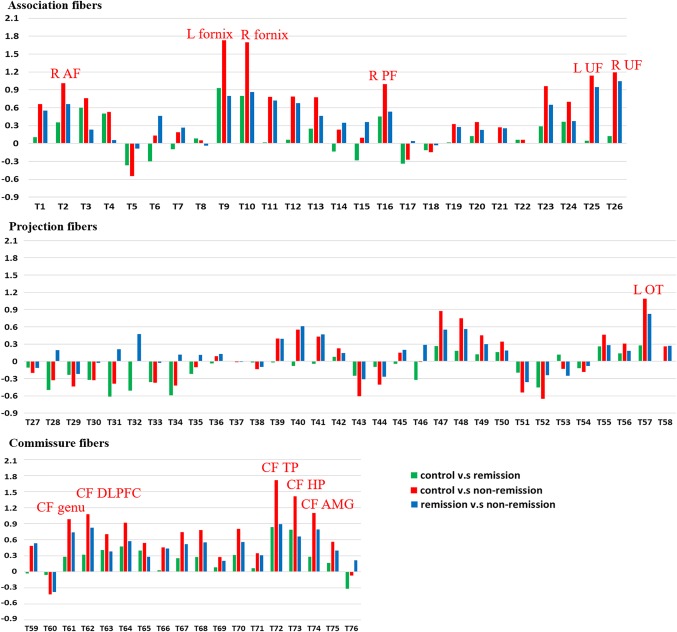
The effect sizes of post‐hoc between‐groups comparison. X coordinates are the serial numbers of 76 white matter tract bundles from T1 to T76, and Y coordinates are the effect size of each pair of the study groups. All the tracts with significant difference in ANCOVA had an effect size of 0.9 or above. As indicated in the figure, these tracts include the right arcuate fasciculus (R AF), bilateral fornices, bilateral uncinate fasciculi (L UF, R UF), right perpendicular fasciculus (R PF), the left optic tract of the thalamic radiation (L OT), the callosal fibers (CF) connecting the temporal poles (TP), hippocampi (HP), amygdalae (AMG), dorsolateral prefrontal cortices (DLPFC), and orbitofrontal gyri (genu) [Color figure can be viewed at http://wileyonlinelibrary.com]