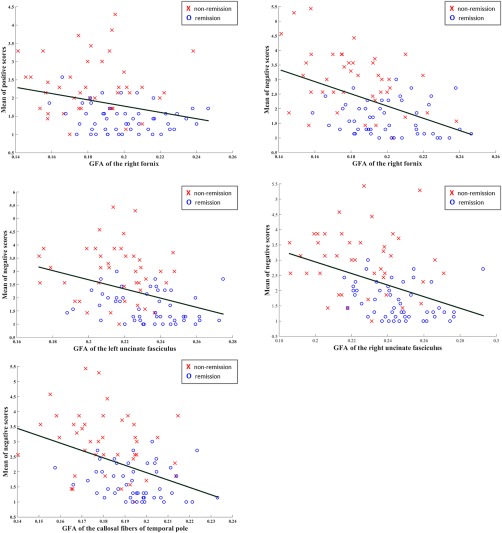
Figure 4.

Correlations between PANSS positive and negative symptom scales and tract integrity of the tracts that were significantly different between remission and nonremission groups. Abbreviation: CF = callosal fibers; GFA = generalized fractional anisotropy, L = left; R = right; TP = temporal pole; UF = uncinate fasciculus [Color figure can be viewed at http://wileyonlinelibrary.com]
