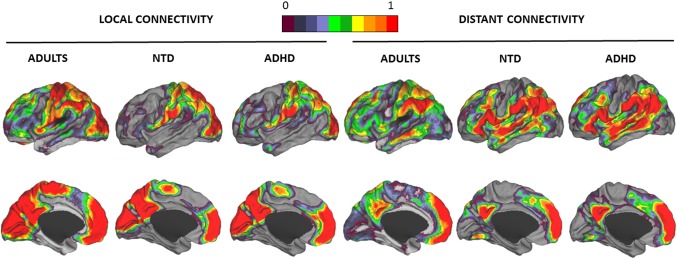
Figure 1.

One‐sample characterization of local and distant functional connectivity levels. Local and distant functional connectivity Z‐score maps in adults, ND children, and children with ADHD. Lateral and medial views of the left hemisphere are presented. Surface projection used the PALS surface (PALS‐B12) provided by Caret software using the “interpolated algorithm” and “multifiducial mapping” settings (Van Essen & Dierker, 2007). The color bar represents the normalized Z‐scores. Only positive Z‐score values are plotted, 0 corresponding with a Z‐score value of 0 and 1 corresponding with Z‐score values ≥ 1. Local and distant adult's maps were taken from a previous study (Sepulcre et al., 2010). The color spectrum was the same used by Sepulcre et al. (2010) to make the images comparable [Color figure can be viewed at http://wileyonlinelibrary.com]
