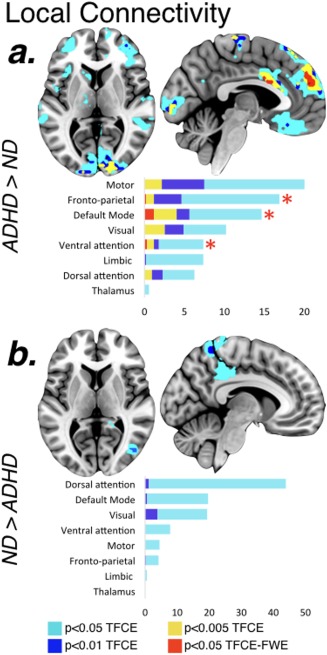
Figure 2.

Group differences in the degree of local functional connectivity. Differences in local functional connectivity between children with ADHD and ND children. (a) Regions where patients with ADHD have more local functional connectivity compared with ND children; (b) Regions where patients with ADHD have less local functional connectivity compared with ND children. The results have different colors for different thresholds and bar graphs represent the percentage of voxels in each of the large‐scale functional networks over the total significant voxels under the most lenient threshold of p < .05‐TFCE. Red asterisks represent the clusters of increased local functional connectivity surviving the most restrictive threshold corrected for multiple comparisons (p < .05 TFCE–FWE) [Color figure can be viewed at http://wileyonlinelibrary.com]
