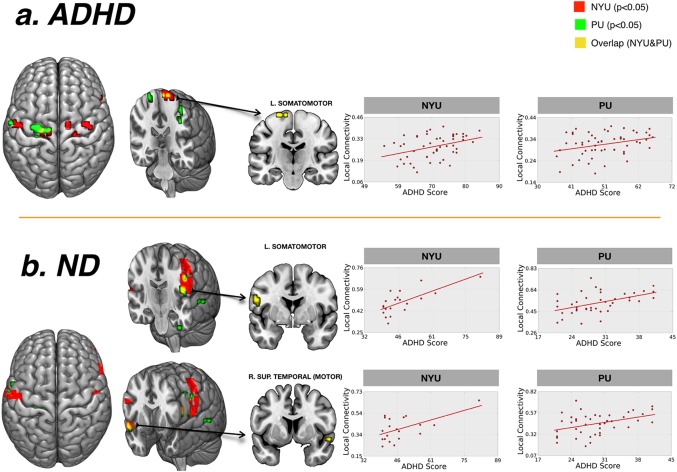
Figure 4.

Correlations with clinical measures. Results of the regression analysis between the degree of local functional connectivity and ADHD clinical scores. The y‐axis represents the mean degree of local functional connectivity of the region after removing the effect of age and FD. The x‐axis represents ADHD clinical severity score (based on the ADHD Rating Scale (ADHD‐RS) score for PU; and based on the Conners’ Parent Rating Scale‐Revised, Long version (CPRS‐LV) score for NYU). The local connectivity values are in the normalized scale detailed in methods (from 0 to 1). Results presented correspond to those voxels below an uncorrected p < .05 obtained in the NYU, PU, and both sites (displayed in red, green and yellow colors respectively). L: left hemisphere; R: right hemisphere; ND, neurotypically developing children. [Color figure can be viewed at http://wileyonlinelibrary.com]
