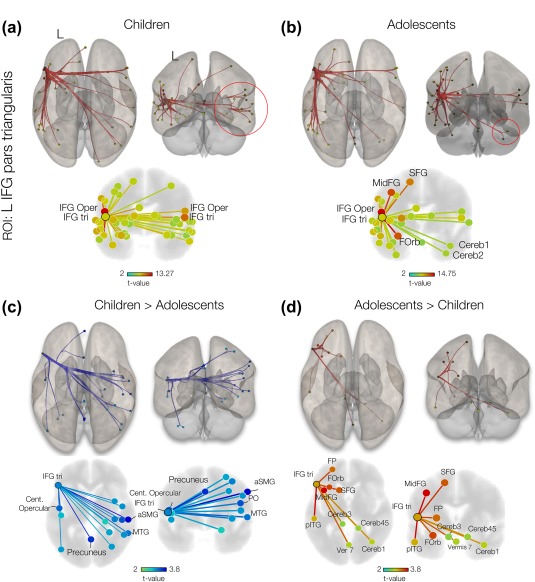
Figure 3.

Seed (IFG.tri)‐to‐ROI connectivity analysis. (A) 3D displays of supra‐thresholded (p‐FDR < 0.05) one‐sided (positive) connectivity of children and, (B) adolescents. The left IFG pars triangularis was used as sources in the seed‐to‐ROI analyses. Red circles indicate the regions with different connectivity pattern in two groups. 3D displays of supra‐thresholded (p‐FDR < 0.05) connectivity contrast with ROI source selected at IFG pars triangularis for young children (C) and (D) adolescents. Anterior supramarginal gyrus (aSTG), parietal operculum cortex (PO), insular cortex (IC), lateral occipital cortex (LOC), superior frontal gyrus (SAG) and middle frontal gyrus (MidFG), frontal pole (FP) and Inferior temporal gyrus (IT) are specified in the figure. [Color figure can be viewed at http://wileyonlinelibrary.com]
