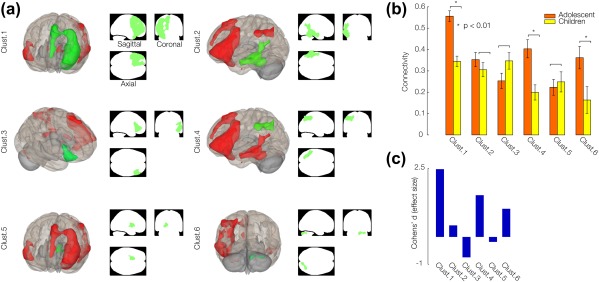
Figure 4.

Connectivity clusters suggested by group seed‐to‐voxel analysis. (A) 3D volume displays of supra‐thresholded by a combination of height (voxel‐level) threshold of p‐FDR < 0.001 and extent (cluster‐level) threshold of p‐FDR < 0.05 with seed selected at IFG pars triangularis for all participants (young children and adolescents). Details of clusters are reported in the Table. 4. (B) between‐subjects effect size (fisher‐transformed group wise difference in connectivity) representing the mean and standard deviation of 6 connectivity clusters. Significant differences in correlations are denoted by ‘*’. (C) Cohen's d (effect size) of the comparison between the two groups evaluated for 6 connectivity clusters. [Color figure can be viewed at http://wileyonlinelibrary.com]
