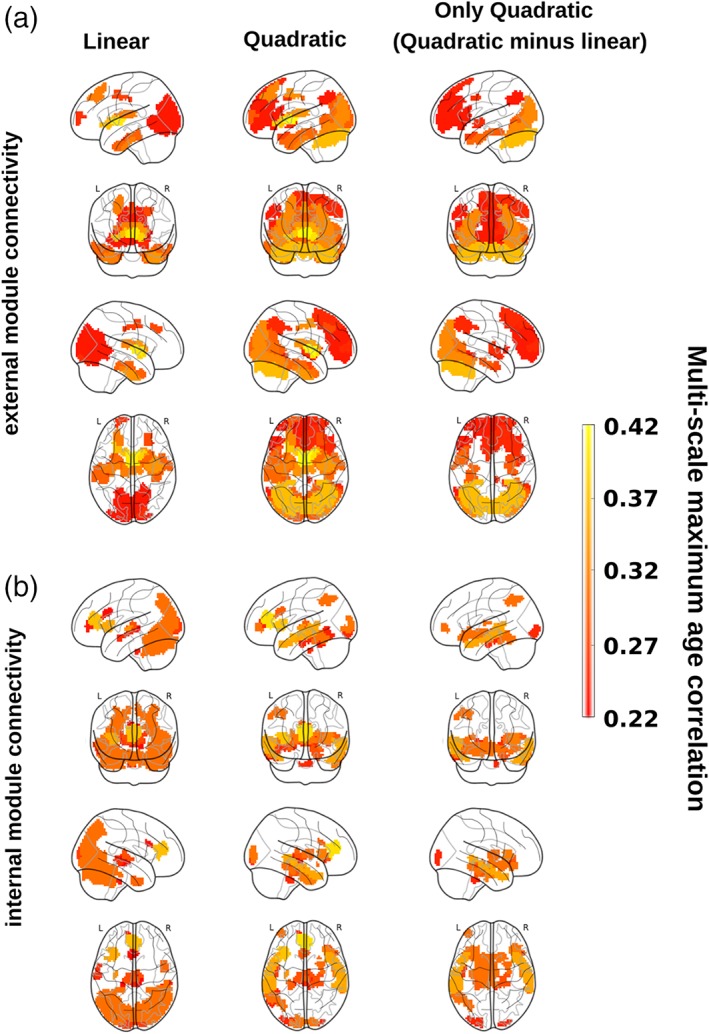
Figure 3.

Structure–function correlo‐dendrograms (CDGs) and brain maps of maximum age correlation across all levels of the multi‐scale brain partition. To build structure–function CDGs, we calculated for each module appearing in the BHA partition (20 ≤ M ≤ 1,000) the correlation (and associated p value) between age participant and FEC, FIC, SEC, and SIC and assessed the structure–function module connectivity as the geometric mean of the two correlation values, one achieved by the functional feature and the other by the structural one. By varying the level M in the multi‐scale brain partition, brain maps were obtained by plotting the maximum value of correlation across all M levels in the CDG (that we have defined as the multi‐scale maximum age correlation). Brain maps are obtained by separating the analyses of external (panel a) and internal (panel b) module connectivity after linear (left column) and quadratic (middle column) fits. For illustration purposes, we also plot the difference between the two brain maps, quadratic minus linear (right column). All the nonzero correlation values plotted here are statistically significant after Bonferroni correction [Color figure can be viewed at http://wileyonlinelibrary.com]
