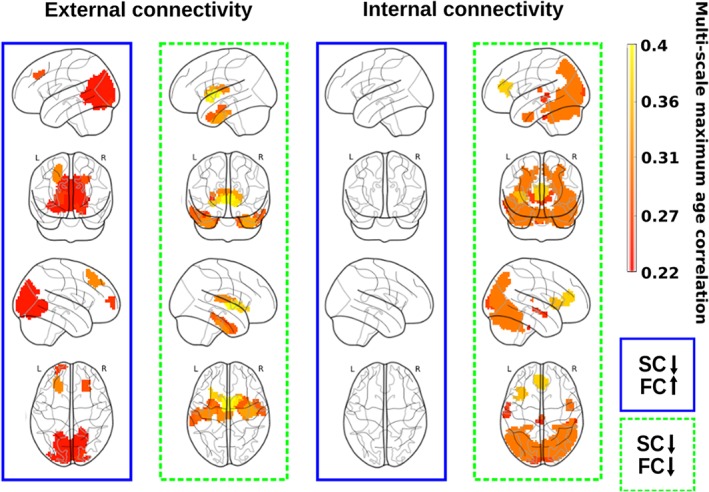
Figure 4.

Functional connectivity modulation by variations in the structural connectivity along lifespan. SC decreases with age, but FC might either increase (blue rectangle) or decrease (green rectangle), and the latter only occur when looking to external connectivity patterns (left column). Indeed, when looking to internal connectivity patterns (right column), the situation of SC decreasing and FC increasing did not exist (transparent brains), and the connectivity patterns only reflect both SC and FC decreasing with age (green rectangle) [Color figure can be viewed at http://wileyonlinelibrary.com]
