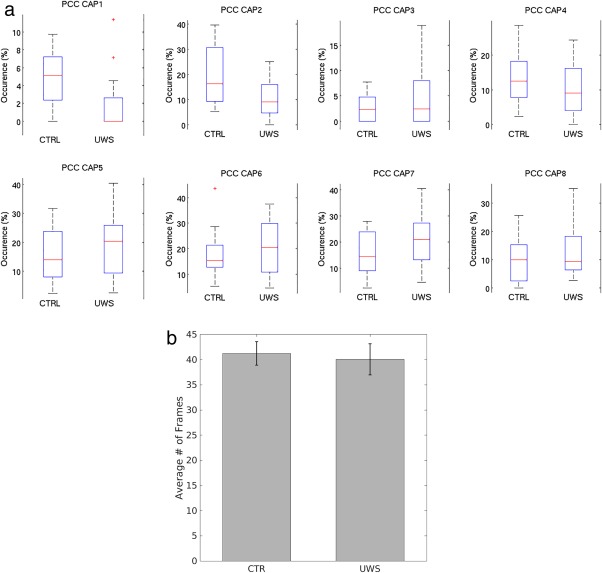
Figure 1.

Boxplots show differences in the occurrence of the two populations (i.e., controls and UWS) per each of the 8 CAPs (a). The tops and bottoms of each “box” are the 25th and 75th percentiles of the samples, respectively. The line in the middle of each box is the sample median. The whiskers are drawn from the ends of the interquartile ranges to the furthest observations within the whisker length (the adjacent values). Red crosses indicate outliers. Note that only CAP 1 and CAP 2 show a significant difference in occurrence across the two groups (a). Bars show the total number of frames in patients and controls (b). CTR = controls; UWS = unresponsive wakefulness syndrome; PCC = posterior cingulate cortex.
