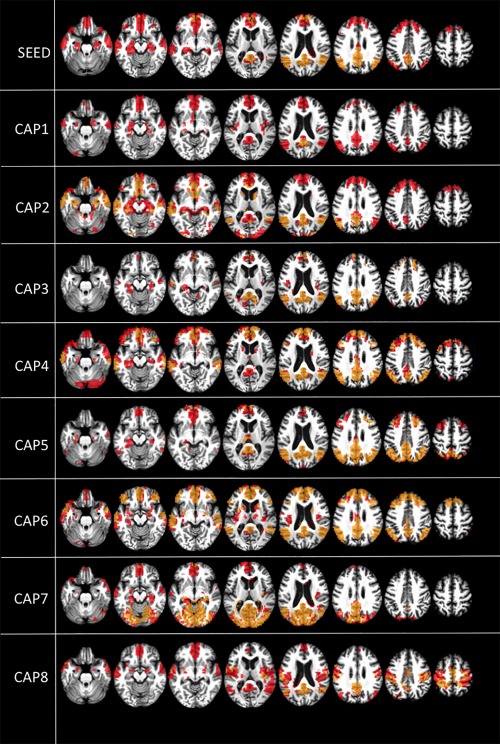
Figure 2.

Default mode network (DMN) within‐network positive correlations. Positive correlations within the DMN (t contrast) in healthy controls (red) and unresponsive patients (yellow/orange). Results are shown at P < 0.05 false discovery rate (FDR) corrected. Upper row shows PCC seed‐voxel correlation maps. Images are displayed on a T13D study template. CAP = co‐activation pattern.
