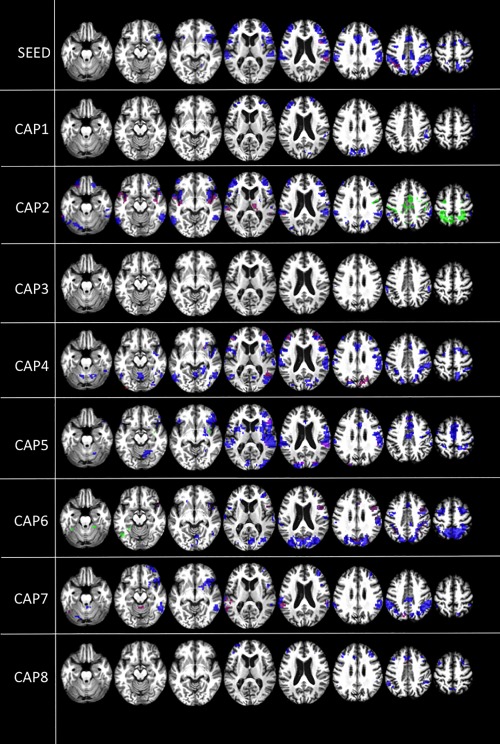
Intergroup differences in DMN between‐network correlations. Between‐network negative correlations (
t contrast), where patients < controls (blue), patients > controls (green), and emergence of between‐network positive correlations in patients compared to controls (purple). Results are shown at
P < 0.05 false discovery rate (FDR) corrected. Upper row shows PCC seed‐voxel correlation maps. [Color figure can be viewed at
http://wileyonlinelibrary.com]

