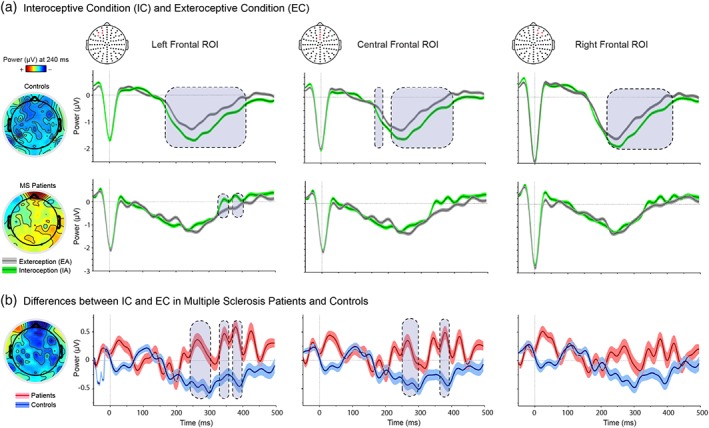
Figure 1.

HEP results. (a) Modulations during the IC (green) and the EC (gray). The three top panels show the results of controls in both tasks, whereas the three bottom panels show the results in patients. Results for each ROI are shown separately from left to right. Scalp topography shows the differences in amplitude (microvolts) between conditions for each group. (b) Differences between IC and EC. Scalp topography shows the differences in amplitude (microvolts) between groups. For a and b: Gray boxes show statistically significant differences (at p < .05 for a minimum extension of five consecutive points of difference, following previous reports (Garcia‐Cordero et al., 2016), and shadowed bars around potentials indicate SEM statistical details in Supporting Information Tables S4 and S6
