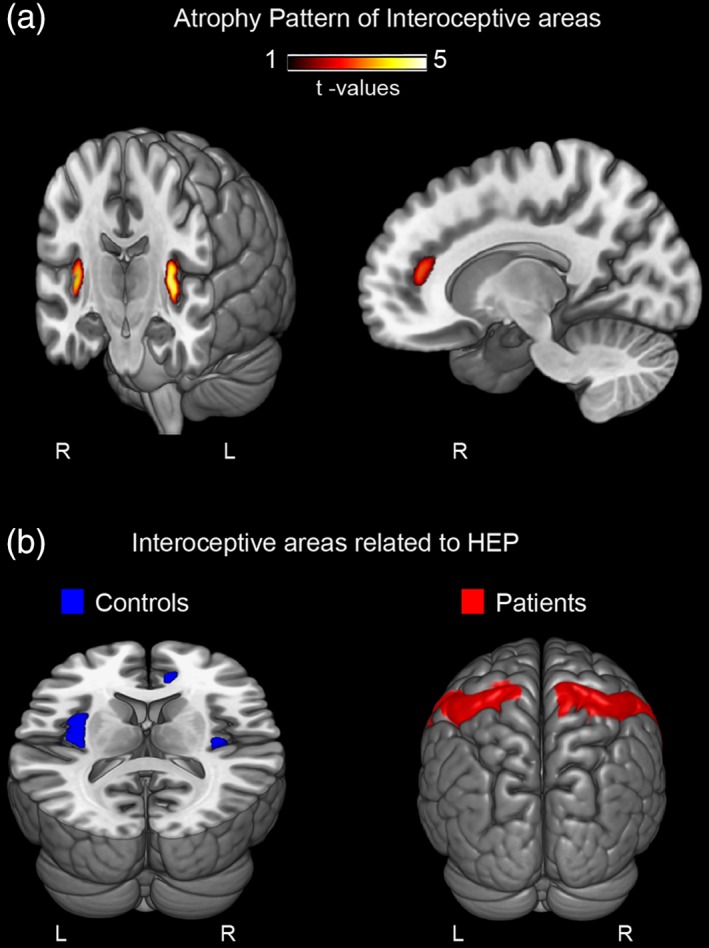
Figure 2.

VBM: Multiple sclerosis atrophy and brain‐behavior association. (a) Atrophy pattern of multiple sclerosis patients compared with controls. VBM was performed within key interoceptive areas (namely: the insula, the ACC, and the SSC) and a control region (superior occipital cortex) (p < .001 uncorrected). Statistical details in Supporting Information Table S7. (b) Correlations between results from the VBM group comparison and HEP subtraction. The bilateral insula and the right ACC were significantly associated with HEP subtraction results in the control sample. No association was found with the SSC for this group. On the other hand, multiple sclerosis patients presented significant correlations only between HEP subtractions and the bilateral SSC. Both groups presented no association with the superior occipital cortex. L = left; R = right. See Supporting Information Figure S4 for the scatter plots of each of these correlation analyses
