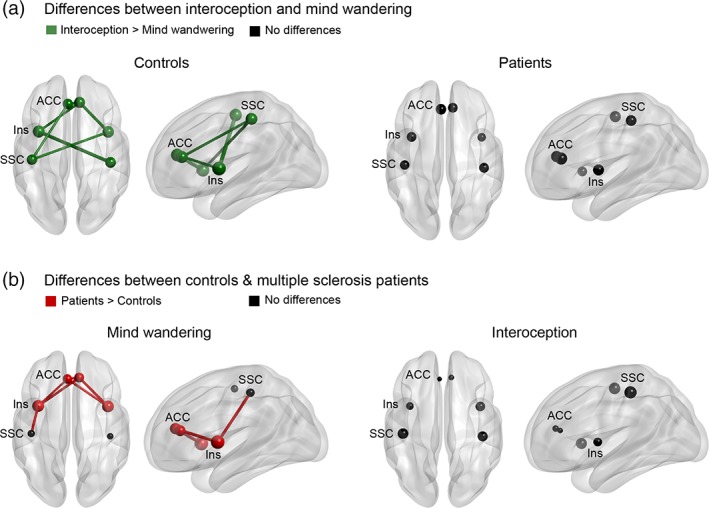
Figure 3.

Functional connectivity results. (a) Differences between conditions. While for the control sample ISt showed greater inter‐regional connectivity and greater K compared with MW, no differences were found in multiple sclerosis patients. Figure supported by Supporting Information Tables S9 and S10. (b) Between‐group differences in the mind‐wandering and interoceptive conditions. While patients presented greater inter‐regional connectivity and K than controls for MW, no differences were found during the interoceptive condition. For (a) and (b): Links indicate interregional connectivity. Circles indicate network degree (K). Colors indicate statistically significant differences (p < .05; green = interoception > mind wandering; red = MS patients > controls; black = no significant differences). ACC: anterior cingulate cortex, INS: insula, SSC: somatosensory cortex. Figure supported by Supporting Information Tables S11 and S12
