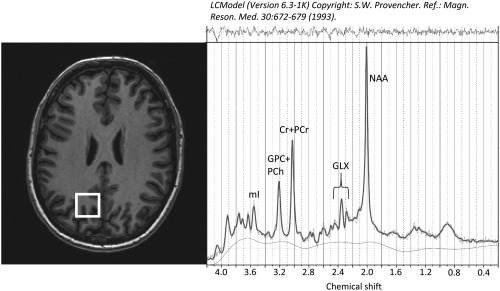
Figure 1.

Voxel position in the left parietal lobe (white rectangle on axial T1 image) and representative magnetic resononance spectrum. mI = myo‐inositol; GPC + PCh = glycerophosphocholine + phosphocholine; Cr + PCr = creatine + phosphocreatine; GLX = glutamate + glutamine; NAA = N‐acetylaspartate
