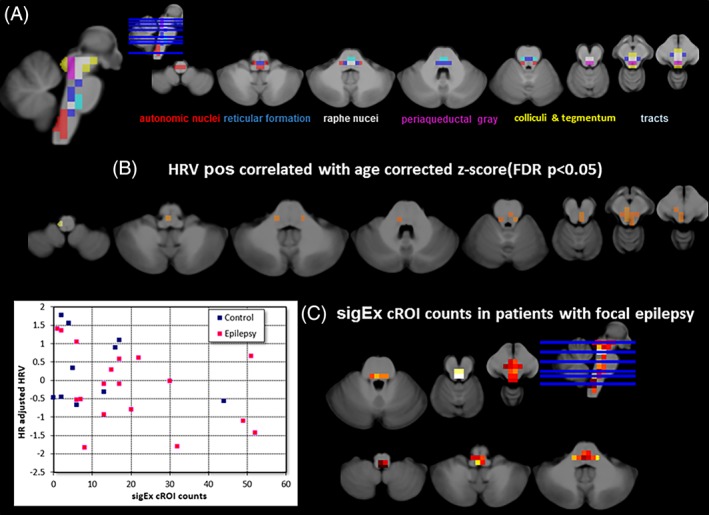
Figure 2.

The upper panel (a) shows the distribution of the cROIs across the brainstem and their assignment to different systems known to be involved in autonomic control. The middle panel (b) shows the results of the processing with the standard approach. The distribution of cROIs whose mean age‐corrected z‐scores were significantly (p < .05 FDR) correlated with heart rate corrected HRV in the patients of the autonomic group. The lower panel (c) shows the results of the processing with the PSI‐based approach. On the left is the scatter plot of the sigEx cROI counts and HRV in patients (red dots) and controls (blue dots) (please see text for correlations) and on the right is the distribution of sigEx cROIs in the patients of the autonomic group. The color indicates the number of patients who had sigEx cROIs in this particular location with bright yellow indicating the highest number (n = 13) and dark red the lowest number (n = 1). sigEx cROIs with high subject counts were found in the region of periaqueductal gray and the raphe and reticular nuclei but also in some autonomic nuclei [Color figure can be viewed at http://wileyonlinelibrary.com]
