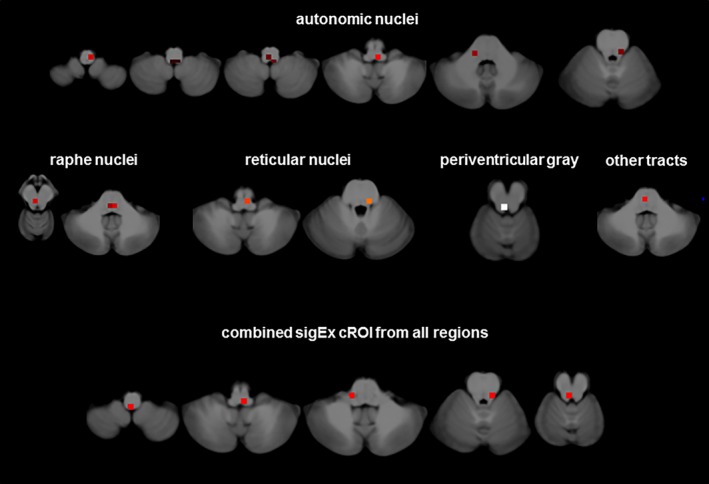
Figure 3.

sigEx cROIs sharing the largest amount of the variation with heart rate corrected HRV in ASF patients for each of the six regions with significant correlations separately and for the sigEx cROIs from all regions combined. Please refer to the text for r and p values [Color figure can be viewed at http://wileyonlinelibrary.com]
