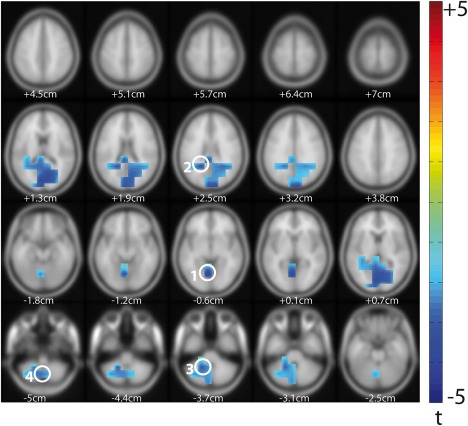
Figure 5.

Linear regression analysis of AIS and ADI‐R scores. Results of linear (permutation) regression with ADI‐R rit algorithm scores as predictor variable and AIS as response variable (ASD only, n = 14, t values masked by p < .05, cluster correction). Z values are shown below each brain slice. Peak voxels are highlighted with white circles and numbers; corresponding MNI coordinates and labels are given in Table 3 [Color figure can be viewed at http://wileyonlinelibrary.com]
