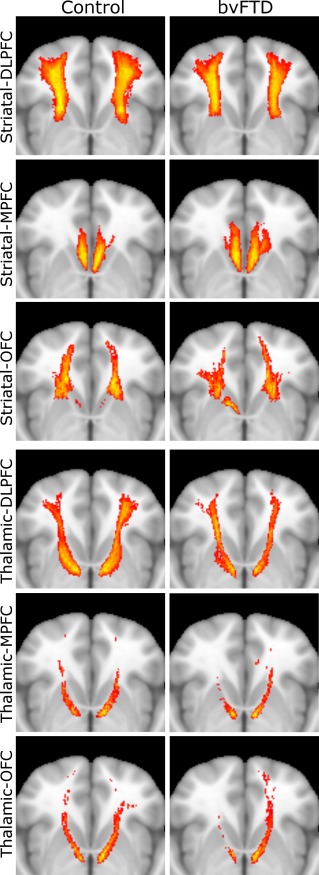
Figure 2.

Frontal–striatal (top three rows) and frontal–thalamic (bottom three rows) pathways in controls (left column) and bvFTD participants (right column). Horizontal view of pathways aligned to MNI152 space and superimposed on standard MNI152 brain. Colors reflect extent of overlap between participants, with red indicating at least 50% overlap and yellow indicating 100%. bvFTD = behavioral variant frontotemporal dementia; DLPFC = dorsolateral prefrontal cortex; MPFC = medial prefrontal cortex; OFC = orbitofrontal cortex [Color figure can be viewed at http://wileyonlinelibrary.com]
