
Figure 3.
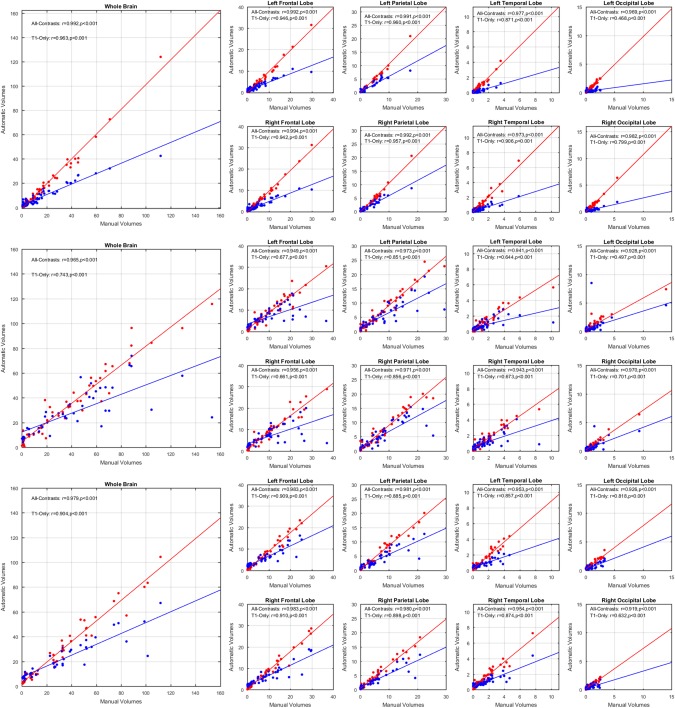
Total brain and per lobe correlations for automatic versus manually segmented WMH volumes (CCs), using all contrasts available (red) and using only T1w contrast (blue) for (a) ADC, (b) ADNI1, and (c) ADNI2/GO datasets [Color figure can be viewed at http://wileyonlinelibrary.com]