
Figure 8.
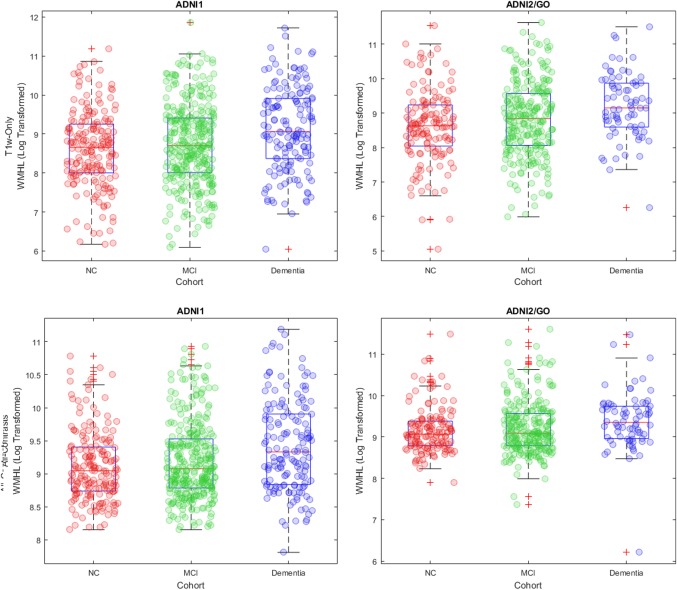
Boxplots of log transformed WMHLs for NC, MCI, and dementia cohorts. WMHL = white matter hyperintensity load; NC = normal control; MCI = mild cognitive impairment [Color figure can be viewed at http://wileyonlinelibrary.com]
Official websites use .gov
A
.gov website belongs to an official
government organization in the United States.
Secure .gov websites use HTTPS
A lock (
) or https:// means you've safely
connected to the .gov website. Share sensitive
information only on official, secure websites.
Boxplots of log transformed WMHLs for NC, MCI, and dementia cohorts. WMHL = white matter hyperintensity load; NC = normal control; MCI = mild cognitive impairment [Color figure can be viewed at http://wileyonlinelibrary.com]