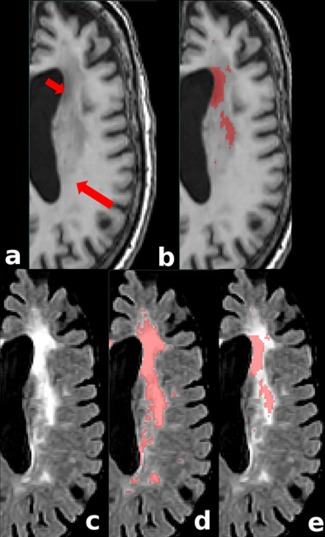
Figure 9.

Comparing FLAIR hyperintensities and T1w hypointensities. (a) T1w image showing different hypointense values: short and long arrows indicate lower and higher signals, respectively. (b) T1w manual mask corresponding to a given level of hypointensity in T1w image. Note that only the lower signal areas are labeled as WMHs. (c) FLAIR image (d) FLAIR and manual mask corresponding to WMHs detected based on FLAIR image (d) FLAIR and T1w‐based mask. Note how the hypointense region of the T1w sequence colocalizes only with a portion of the WMHs on FLAIR even though the signal on the FLAIR sequence is mostly homogeneous [Color figure can be viewed at http://wileyonlinelibrary.com]
