Figure 3.

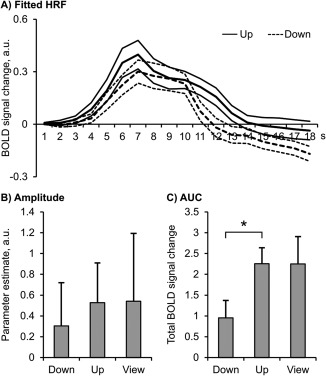
Participants regulated the amygdala response with neurofeedback, comparing the “down” and “up” conditions. N = 20; HRF = hemodynamic response function; AUC = area under the curve; a.u.=arbitrary units; *p < .05. Error bars = SEM

Participants regulated the amygdala response with neurofeedback, comparing the “down” and “up” conditions. N = 20; HRF = hemodynamic response function; AUC = area under the curve; a.u.=arbitrary units; *p < .05. Error bars = SEM