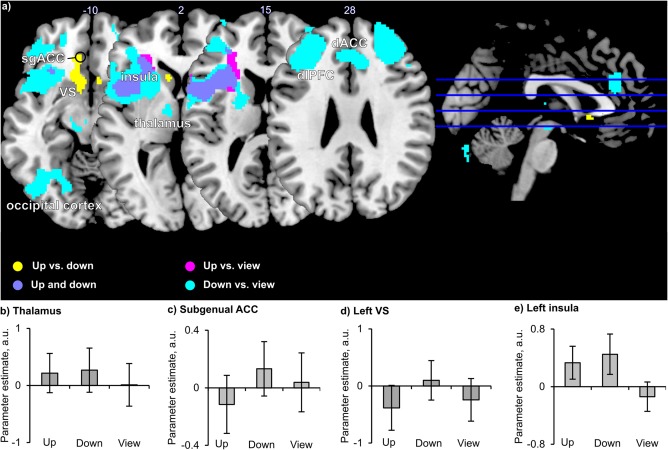
Figure 6.

Brain regions involved in feedback control (N = 20). (a) Activated clusters are displayed upon a canonical T1 brain template. Slice numbers above transversal slices indicate z‐coordinate (top is rostral and left is left), the position of slices is shown by blue lines on a sagittal brain view to the right (x = 0, right is rostral, top is dorsal). (b–e) Parameter estimates extracted from cluster, parameter estimates in (b) and (d) are based on voxels with overlapping feedback monitoring and feedback control activation. VS = ventral striatum; sgACC = subgenual anterior cingulate cortex; a.u. = arbitrary units. Error bars = SD. For labels of x‐axis, see Figure 1 [Color figure can be viewed at http://wileyonlinelibrary.com]
