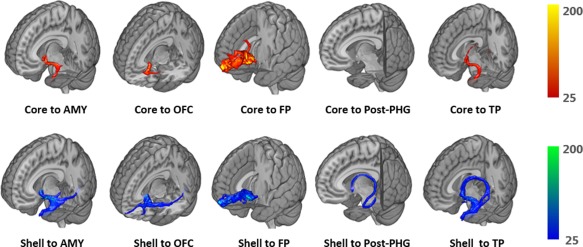
Figure 5.

Probabilistic tractography for several representative tracts in the left hemisphere from one single subject. Voxels are color coded from 25 to 200 (tracts from core are red to yellow, tracts from shell are blue to green) represented the number of fibers passing through the voxel. Corresponding targets from left to right are AMY, OFC, FP, Post‐PHG, and TP [Color figure can be viewed at http://wileyonlinelibrary.com]
