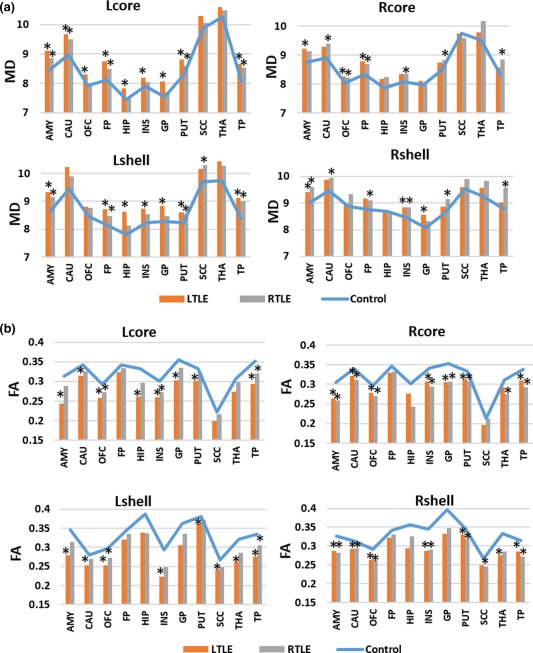
Figure 7.

Comparison of MD and FA values in group averaged white matter tracts that connect ROIs with NAc subdivisions between control and TLE groups. * denotes a significant between‐group difference of p < .05 [Color figure can be viewed at http://wileyonlinelibrary.com]
