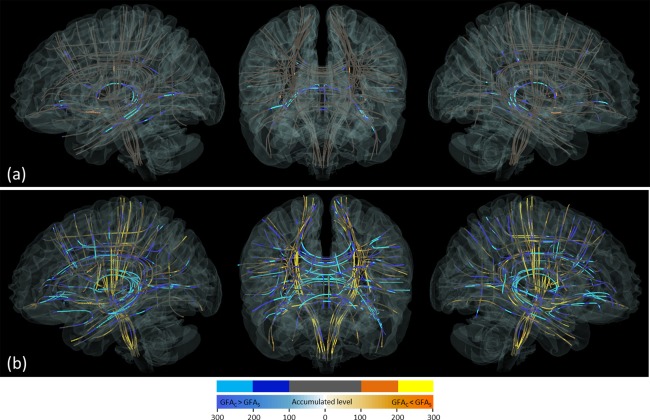
Figure 6.

3D visualization of the heat maps of the brains of the (a) male and (b) female participants. Each fiber tract bundle is represented by a track skeleton. Five discrete colors were assigned according to the number of occurrences in the heat maps. Cold‐colored segments represent those where the control GFA value was larger than the patient value (GFAC > GFAS), whereas the warm‐colored segments represent those where the control GFA value was smaller than the patient GFA value (GFAC < GFAS). The color appears bright if the number of occurrences in the segments was larger than 200, whereas it appears dark if the number was 100–200. Segments with <100 occurrences are shown in gray. [Color figure can be viewed at http://wileyonlinelibrary.com]
