
Figure 7.
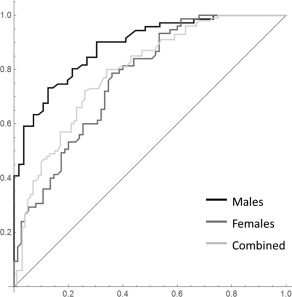
ROC curve analysis for men (black), women (dark gray), and all participants (light gray). The areas under the ROC curves are 0.87, 0.77, and 0.79 for men, women, and all participants, respectively.
Official websites use .gov
A
.gov website belongs to an official
government organization in the United States.
Secure .gov websites use HTTPS
A lock (
) or https:// means you've safely
connected to the .gov website. Share sensitive
information only on official, secure websites.
ROC curve analysis for men (black), women (dark gray), and all participants (light gray). The areas under the ROC curves are 0.87, 0.77, and 0.79 for men, women, and all participants, respectively.