
Figure 3.
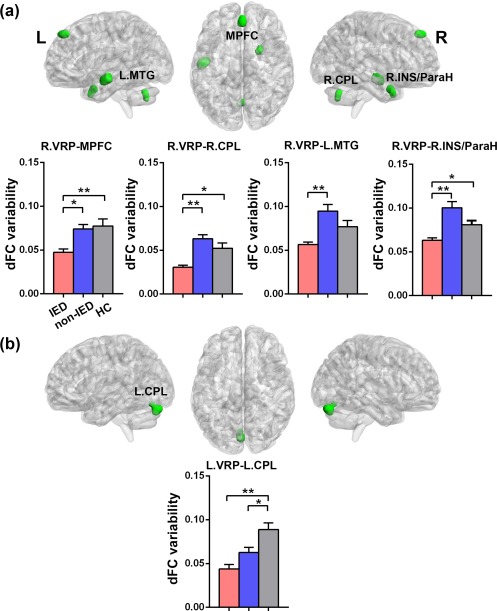
Group differences of dFC variability for bilateral ventral putamen seeds among three groups (HCs, non‐IED, and IED). (a) Brain regions showing significant differences of dFC variability for right VRP (in green) seed. One‐way analysis of variance revealed significant group differences in the right medial prefrontal cortex (MPFC), left middle temporal gyrus (MTG), right cerebellum posterior lobe (CPL), and right insula/parahippocampus (INS/ParaH). (b) Brain regions showing significant differences of dFC variability for left VRP (in green) seed. Significant group differences were seen in the left CPL. Gaussian random field theory was used for cluster‐level multiple comparisons correction (minimum z > 2.3; cluster significance: p < .05, GRF corrected). ROI‐wise post hoc analysis results are illustrated in the bar charts (*p < .05, uncorrected; **p < .05, Bonferroni correction). dFC = dynamic functional connectivity; VRP = ventral rostral putamen; L = left; R = right [Color figure can be viewed at http://wileyonlinelibrary.com]