
Figure 3.
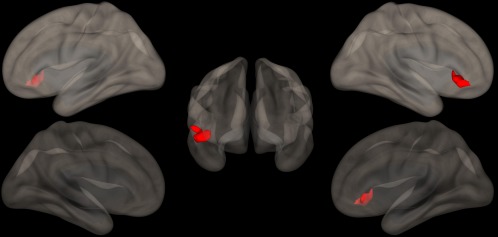
Direct correlations between the FC of the precuneus and the scores at the CBTT. A cluster of significantly correlated FC (p = .0001) is evident at the level of right inferior frontal gyrus, superimposed on the 3‐dimensional rendering of a healthy brain in the MNI space. ERT: enzyme replacement therapy; FD: Fabry disease; HC: healthy control; n/a: not applicable. Ages are expressed in years, while ERT duration is expressed in months. Renal failure considered present when the estimated glomerular filtration rate of the patient was < 90 mL/min (no patient had end‐stage renal disease requiring dialysis), while proteinuria was considered present when the patient scored a value > 150 mg/24 hr. MPFC: medial prefrontal cortex; PCC: ventral portion of the precuneus; RPL: right parietal lobule; MNI: Montreal Neurological Institute. Anatomic labeling is according to Tzourio‐Mazoyer et al. (2002) [Color figure can be viewed at http://wileyonlinelibrary.com]