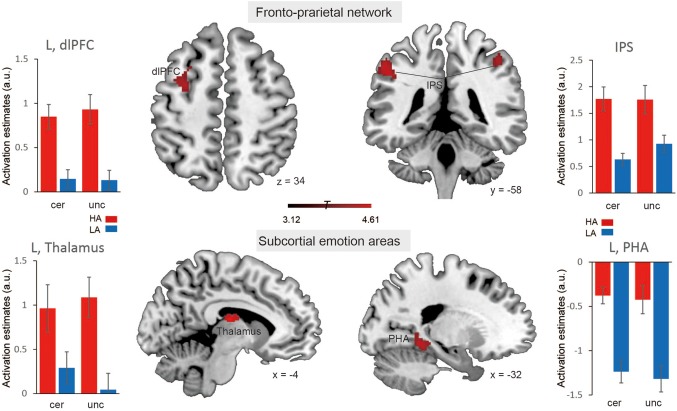
Figure 3.

Brain systems showing significant main effects of trait anxiety. Representative clusters show significant activation (coded in red) during contrasting between the high anxiety group and low anxiety group across anticipation conditions, color bar represents T values. Parameter estimates of uncertain condition and certain condition for the high anxiety (coded in red) and low anxiety (coded in blue) group. Notes: HA, high anxiety; LA, low anxiety; a.u., arbitrary units; dlPFC, dorso‐lateral prefrontal cortex; IPS, inferior parietal sulcus; PHA, para‐hippocampus; L, left; R, right. Error bars, SEM [Color figure can be viewed at http://wileyonlinelibrary.com]
