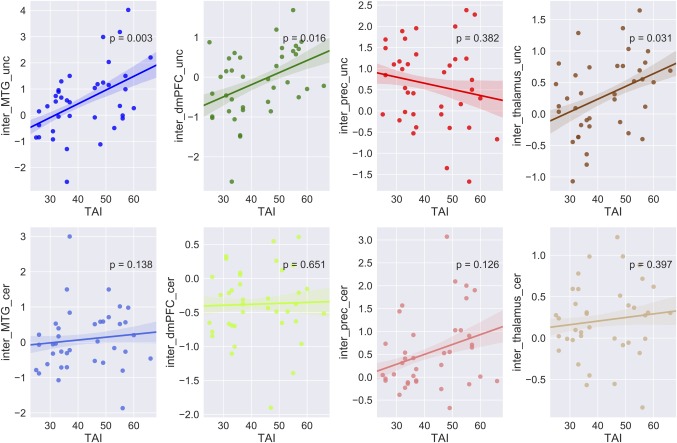
Figure 6.

Correlation between activation of regions in the interaction effects and trait anxiety levels. Brain activation in the interaction effects versus trait anxiety scores. For each column, correlations were showed for uncertain condition (upper) and certain condition (lower). The solid lines represent linear fitting of the correlation, the shadows indicate one standard error. Notes: Notes: HA, high anxiety; LA, low anxiety; dmPFC, dorso‐medial prefrontal cortex; Prec, precuneus; MTG, middle temporal gyrus; L, left; R, right [Color figure can be viewed at http://wileyonlinelibrary.com]
