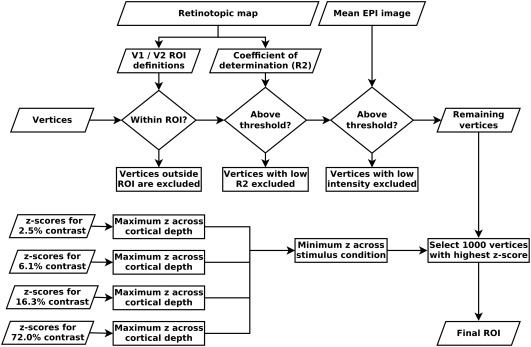
Figure 2.

Overview of region of interest (ROI) selection. Vertices were selected based on a combination of criteria: retinotopic information, mean EPI image intensity, and z‐scores from the GLM analysis. The selection procedure attempts to select vertices with a specific response to the stimulus while minimizing subjective selection bias. This procedure was applied separately for V1 and V2. See Section 2 and Supporting Information, Figure S2 for details
