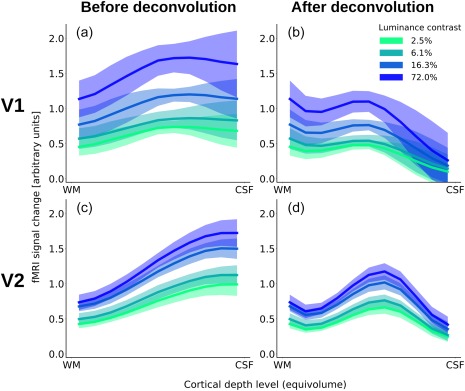
Figure 4.

Cortical depth profiles for V1 (a and b) and V2 (c and d) before (a and c) and after (b and d) accounting for the draining effect. Shown are the mean GLM parameter estimates contrasting the response to the four different stimuli against rest, normalized, and averaged across the left hemispheres of all subjects. The shading depicts the standard deviation (across subjects) of the mean [Color figure can be viewed at http://wileyonlinelibrary.com]
