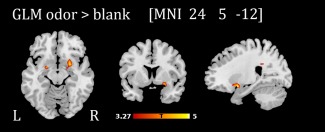
Figure 2.

Activation pattern in the piriform cortex during olfactory stimulation compared to blank trials (results of one‐sample t test on contrast images odor > blank trials for whole sample, n = 48). For illustration purposes, activations are shown at p unc. < .001 [Color figure can be viewed at http://wileyonlinelibrary.com]
