Figure 1.

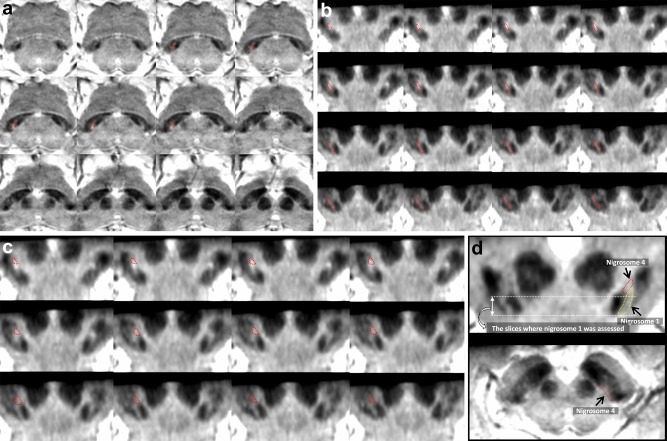
A susceptibility map‐weighted imaging (SMWI) of a 67‐year‐old healthy female. (A) SMWI obtained parallel to the line from the posterior commissure: upper border of the pons shows normal shape and location of the presumed nigrosome 1 regions (indicated with a dotted line) in the dorsal substantia nigra. (B) The reformatted SMWI perpendicular to the midbrain axis shows normal shape and location of the putative nigrosome 1 regions (indicated with a dotted line). The hyperintense region indicative of nigrosome 1 is mainly seen below the red nucleus. The arrows indicate the region of the decussation of the superior cerebellar peduncle. (C). The reformatted SMWI perpendicular to the midbrain axis shows normal shape and location of the putative nigrosome 4 regions (indicated with a dotted line), which is located in medial half of the substantia nigra at the level of lower 1/3 of the red nucleus. (D) Schematic drawing for the putative nigrosome 1 (yellow dotted line) and nigrosome 4 (red dotted line) regions. We assessed the nigrosome 1 below the red nucleus in this study. [Color figure can be viewed at http://wileyonlinelibrary.com]
