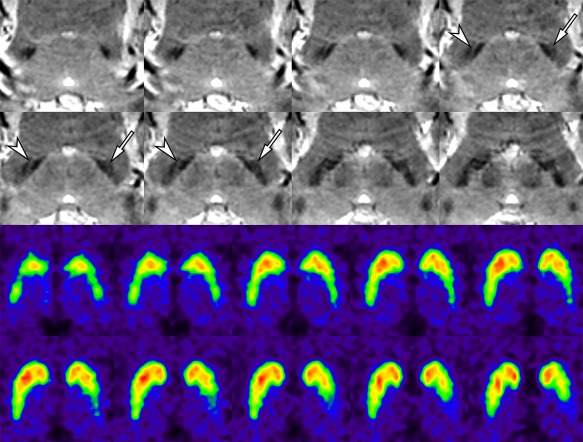
Figure 3.

False‐negative interpretation for the putative nigrosome 1 region in a 58‐year‐old female with IPD (H&Y scale 1). The putative left nigrosome 1 region shows definite abnormality (arrows), whereas the right one maintains hyperintensity between the two adjacent hypointense regions (arrowheads). FP‐CIT PET shows definite and mild abnormality in the left and right basal ganglia, respectively. [Color figure can be viewed at http://wileyonlinelibrary.com]
