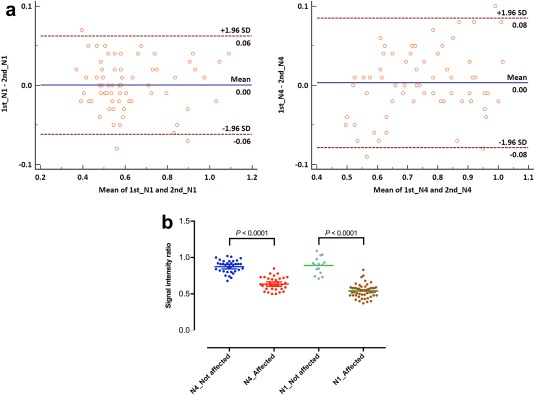
Figure 5.

Measurement of the signal intensity ratios in the nigrosome 1 region and the putative nigrosome 4 region in randomly selected 30 IPD patients and 5 healthy subjects (70 substantia nigras). (A) The Bland–Altman plots for measurement of the signal intensity ratios in the nigrosome 1 region (N1) and the putative nigrosome 4 region (N4) show that most measurements are within the upper and lower 95% limits of agreement (1st, the first reviewer; 2nd, the second reviewer). (B) The signal intensity ratios of the nigrosome 1 and putative nigrosome 4 regions are significantly different between the affected and not affected regions (P < 0.0001, both; Mann–Whitney U test). [Color figure can be viewed at http://wileyonlinelibrary.com]
