
Figure 3.
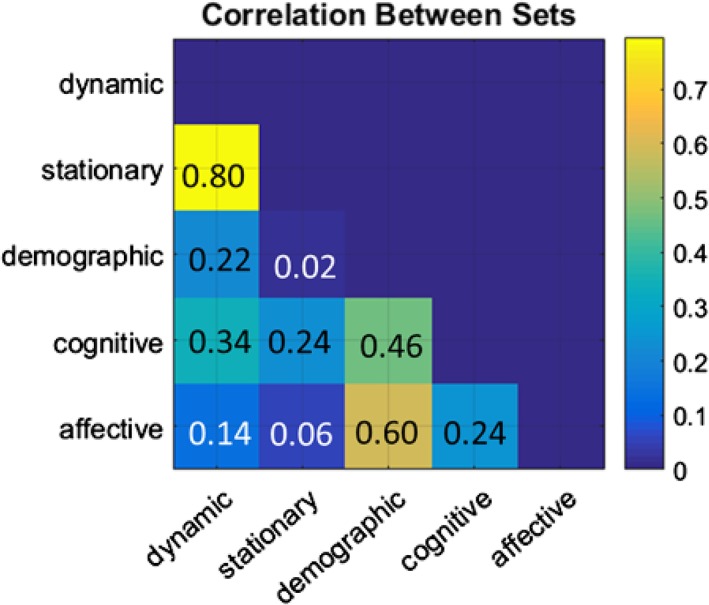
The lower triangle shows the correlation coefficients between all data sets in the significant MCCA component (p = .01 in a permutation test). Each column/row represents the linear combination of the MCCA loadings from all variables within each set. The exact correlation coefficient between two sets is illustrated in each corresponding element [Color figure can be viewed at http://wileyonlinelibrary.com]