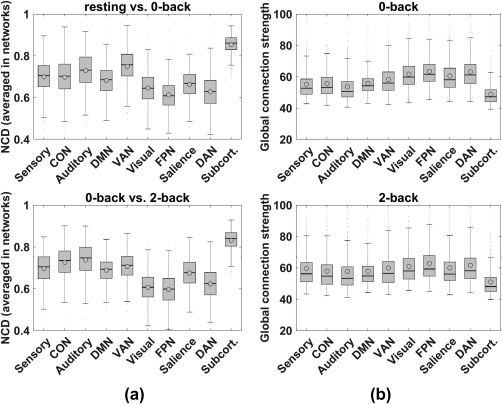
Figure 3.

Enhanced quartile boxplots (circles and horizontal lines inside each box indicate mean and median values of subjects, respectively) for flexibility analyses using NCD (panel a) and connection strength analyses (panel b). Panel a: x‐axis indicates the 10 networks and y‐axis is average NCD for each network. Top plot is for the sequential mental state pairs, resting versus 0‐back, and the bottom plot is for 0‐back versus 2‐back. Each set of error bars indicates SE across the 448 subjects. In each box, the horizontal line indicates median NCD and the circle indicates mean NCD. Panel b: Annotations are similar to those in panel a, except the y‐axis indicates global connection strength from the examined network to the whole brain, separately for 0‐back (top) and 2‐back (bottom)
