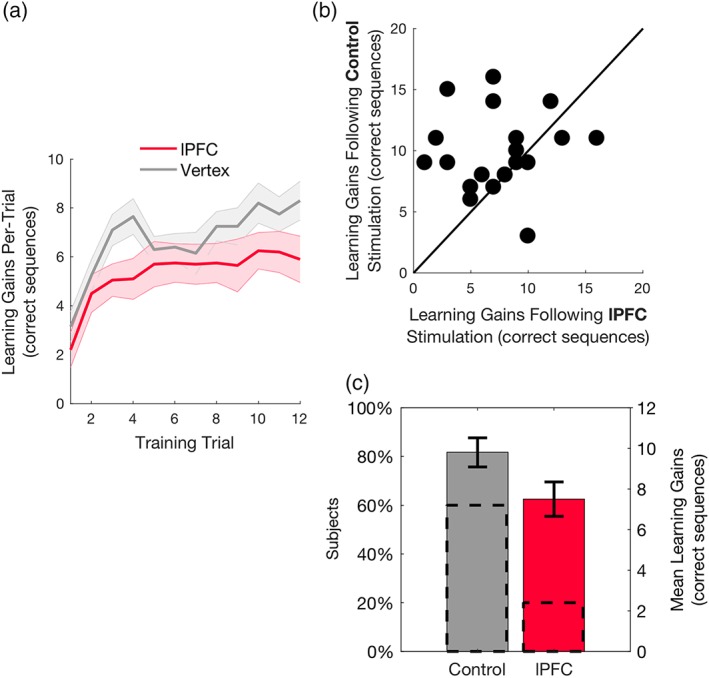
Figure 2.

Effects of stimulation on learning gains. (a) Performance per training block following control and lPFC stimulation. Shaded area denotes standard error of the mean (SEM). (b) Single‐subject data of maximal learning gains following lPFC or control stimulation are presented in a scatterplot along the unit slope line (y = x), where each point reflects a participant (Herszage and Censor, 2017). Data accumulating above the line indicate reduced learning gains following lPFC stimulation (data accumulating exactly on the line indicate equal learning gains in both lPFC and control stimulation). (c) Mean maximal learning gains following lPFC and control stimulation. Dashed lines reflect the percentage of participants on each side of the unit slope line in (b) and the bars reflect the mean maximal learning gains at each session. Error bars represent SEM
