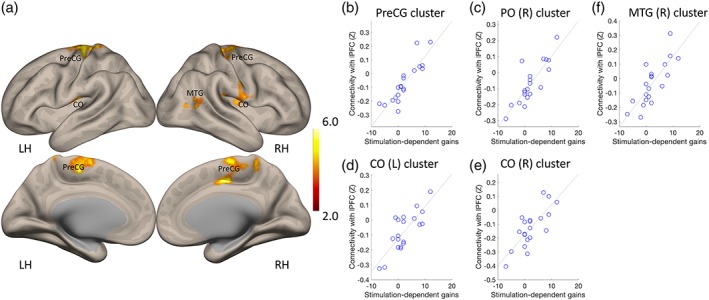
Figure 3.

Clusters of voxels where connectivity with the lPFC was significantly correlated with stimulation‐dependent learning gains. (a) Location of clusters. (b–f) Association between connectivity (fisher Z transformed values) and stimulation‐dependent learning gains in each of the clusters reported in panel (a). LH, left hemisphere; RH, right hemisphere. Color bar represents the strength of the association between connectivity and learning gains (ANCOVA test). CO, central opercular cortex cortex; MTG, middle temporal gyrus; PreCG, precentral gyrus
