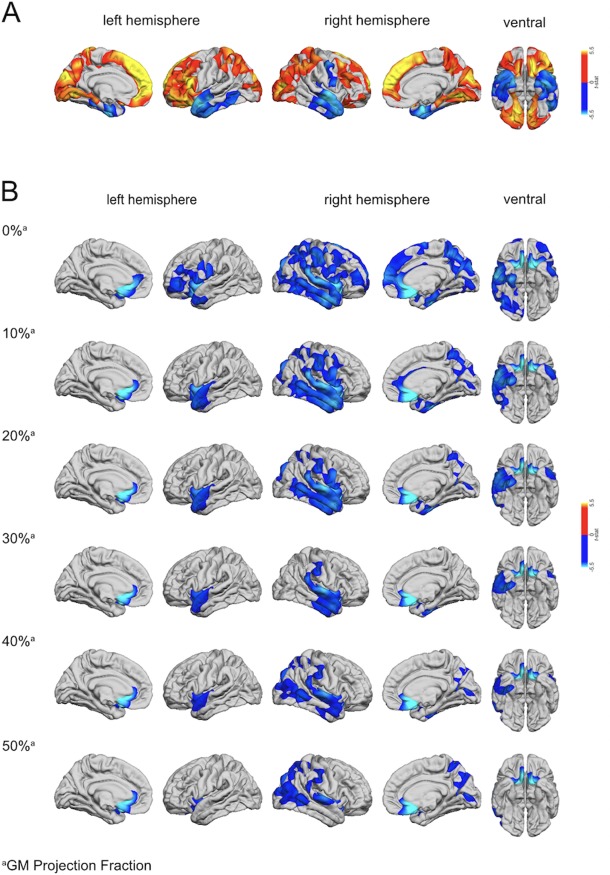
Figure 1.

(a) Regions of increased and decreased cortical thickness (CT) in DS compared to TD controls. The blue to cyan colorscale indicates brain regions with significantly decreased CT in DS relative to TD controls (RFT‐based cluster corrected p < .05, two‐tailed). The orange to yellow colorscale indicates brain regions with significantly increased CT in DS compared to TD controls. (b) Regions with significantly decreased grey–white matter tissue contrast (GWC) in DS (blue colorscale) compared to TD controls (RFT‐based cluster corrected p < .05, two‐tailed) at the grey–white matter boundary (i.e., 0%), and at different CT projection fractions (i.e., sampled from 0% to 50% into the thickness of the cortical ribbon from the pial surface for grey matter in steps of 10%)
